The visual chatPowerBI utilizes a generative artificial intelligence model to interact with the data in your dashboard. There are some best practices to ensure that the AI model achieves greater accuracy in its responses. Let's go through some of them in this article.

- PROVIDE DESCRIPTIVE NAMES FOR COLUMNS
- PROVIDE A TABLE DESCRIPTION
- ADD SOME ADDITIONAL INSTRUCTIONS
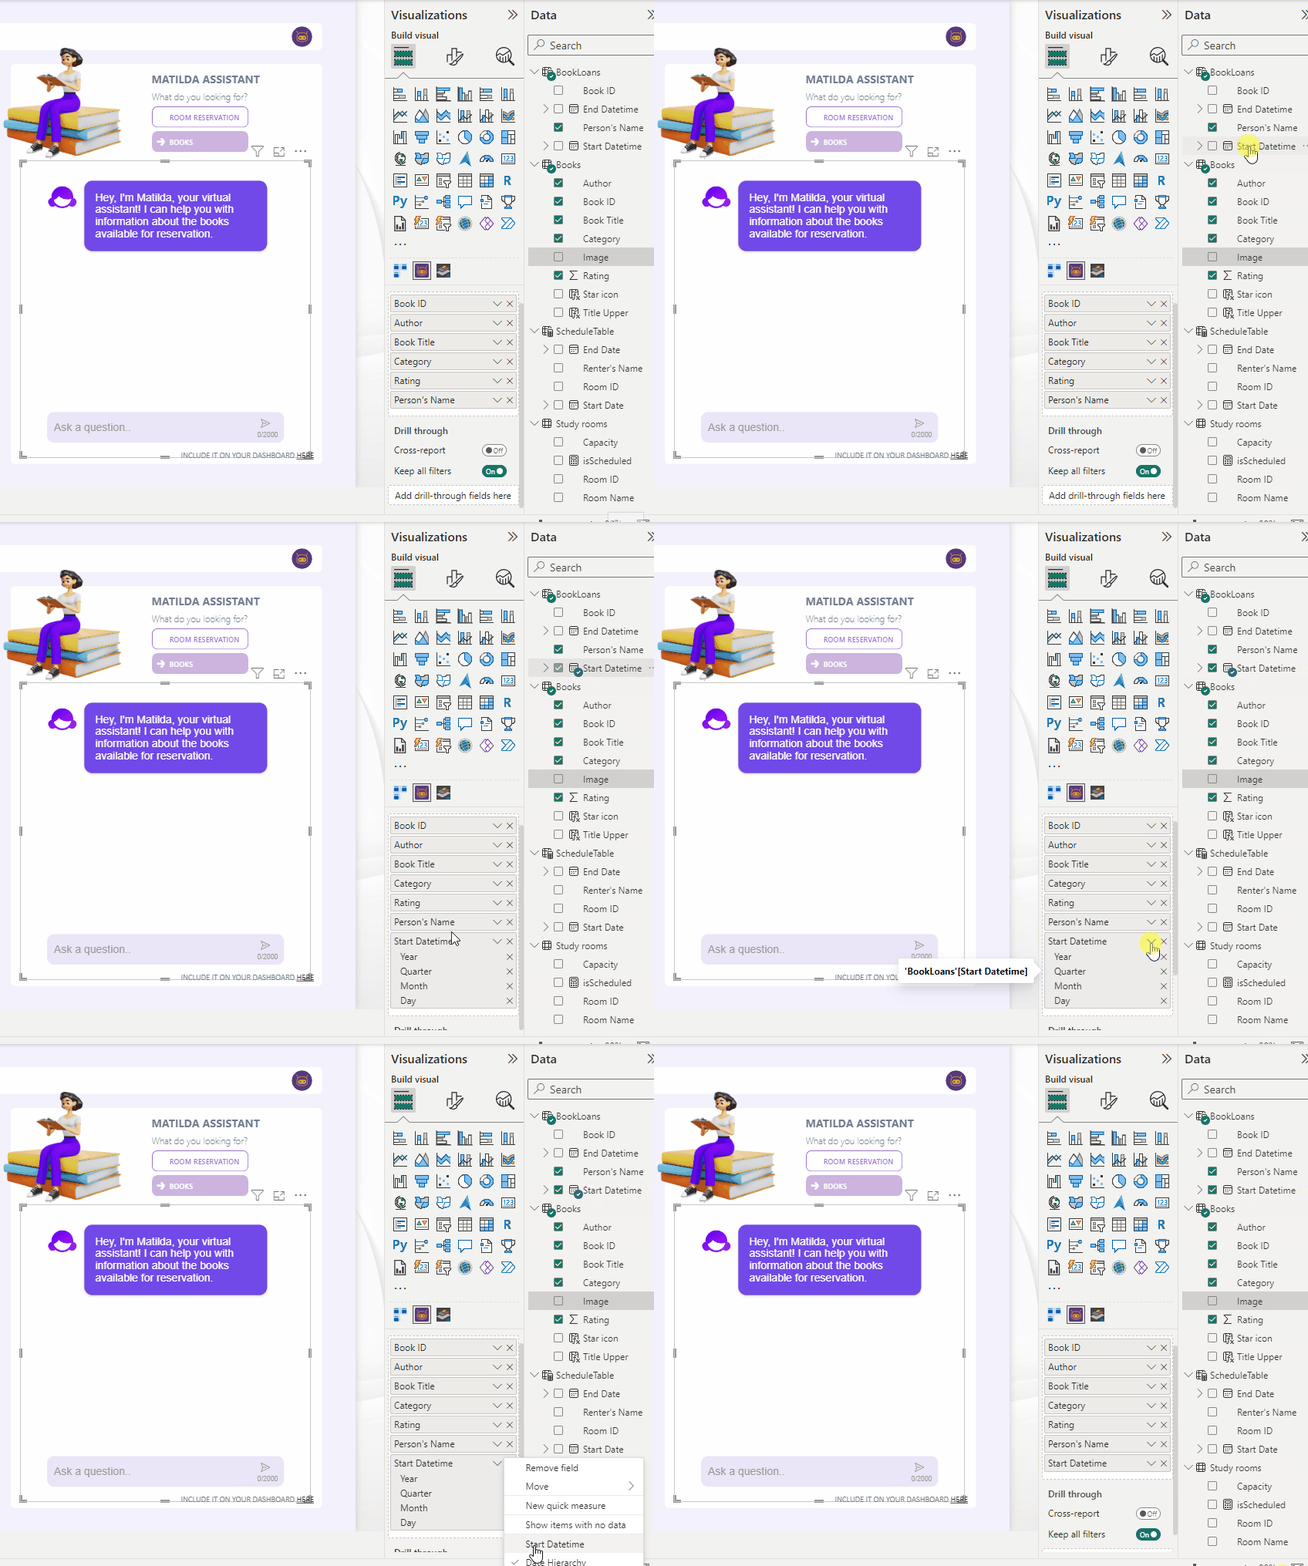
- USE FULL DATES INSTEAD OF DATE HIERARCHY
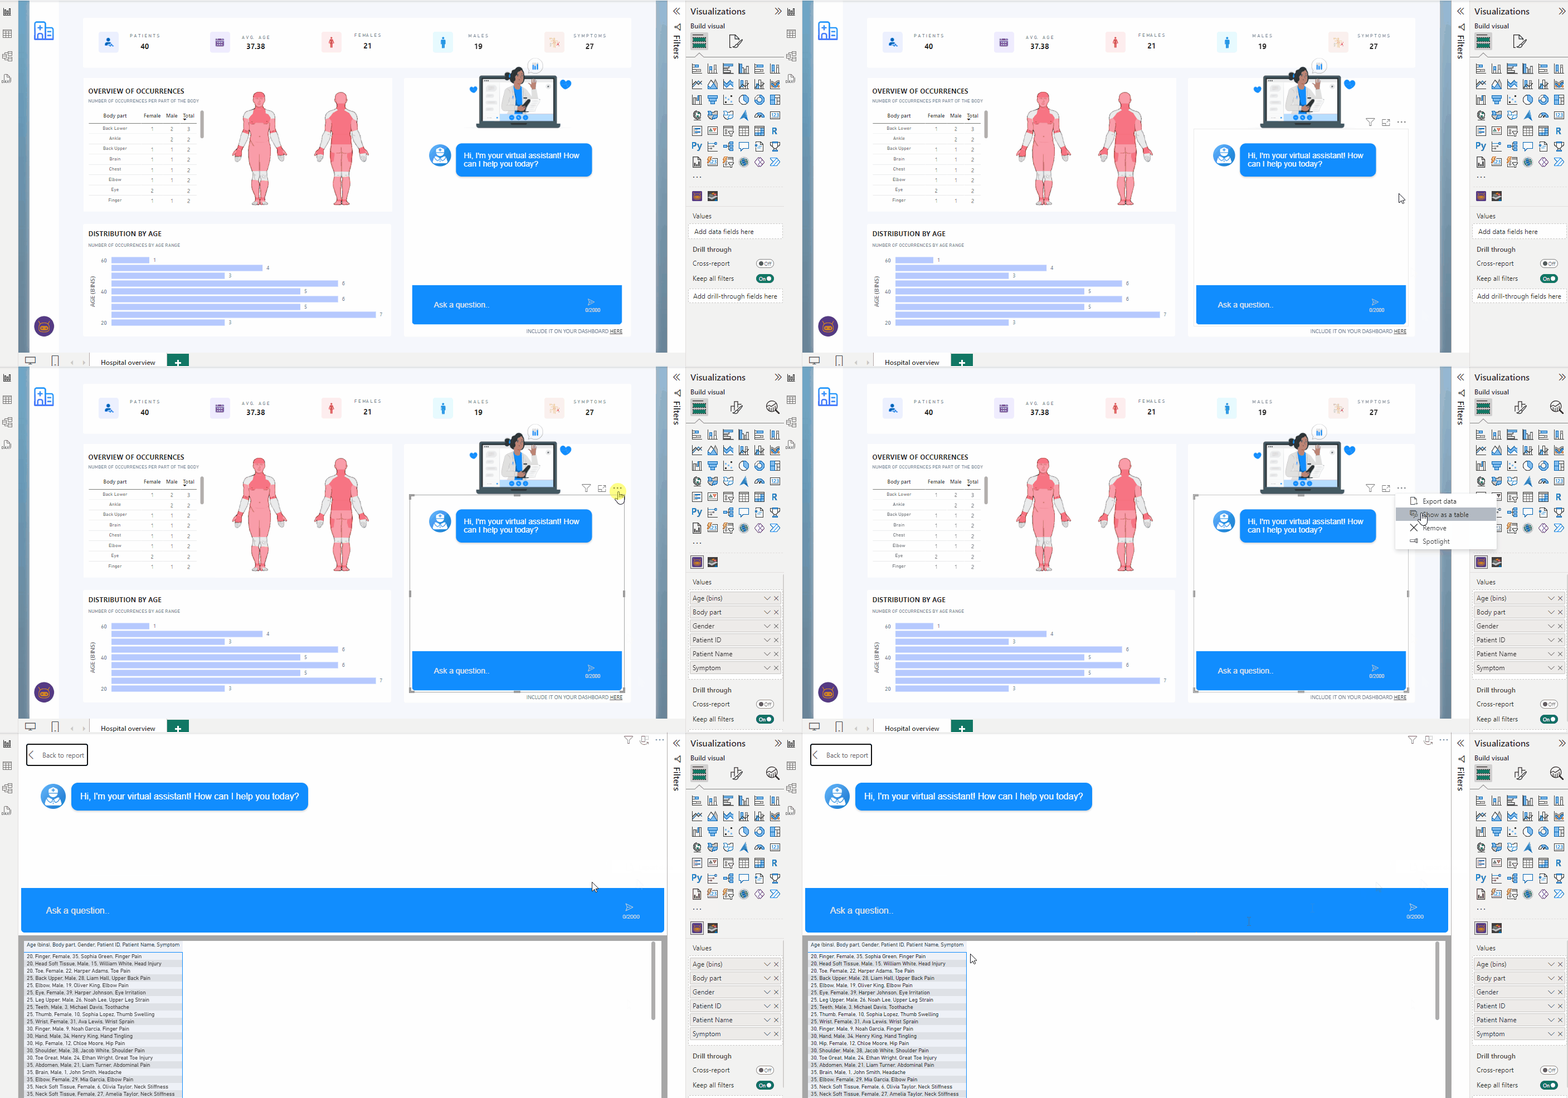
- CHECK HOW THE DATA IS BEING PRESENTED TO THE AI MODEL
- ATTENTION TO COLUMNS WITH NO DATA
- OPTIMIZING INTERACTIVITY
- IMPROVING DATA LOADING SPEED
- ACTIVATE THE SMARTEST AI MODE
For example, instead of using a column named 'DT_DEL_A1', rename it to 'Delivery date attempt 1'.
Notice that in the first format, only those familiar with the system will understand what it represents, whereas the second format is much more intuitive for both humans and the AI model.
For instance, if you provide the following columns to the visual:
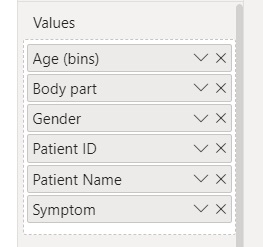 It's important to describe them in the "Table description":
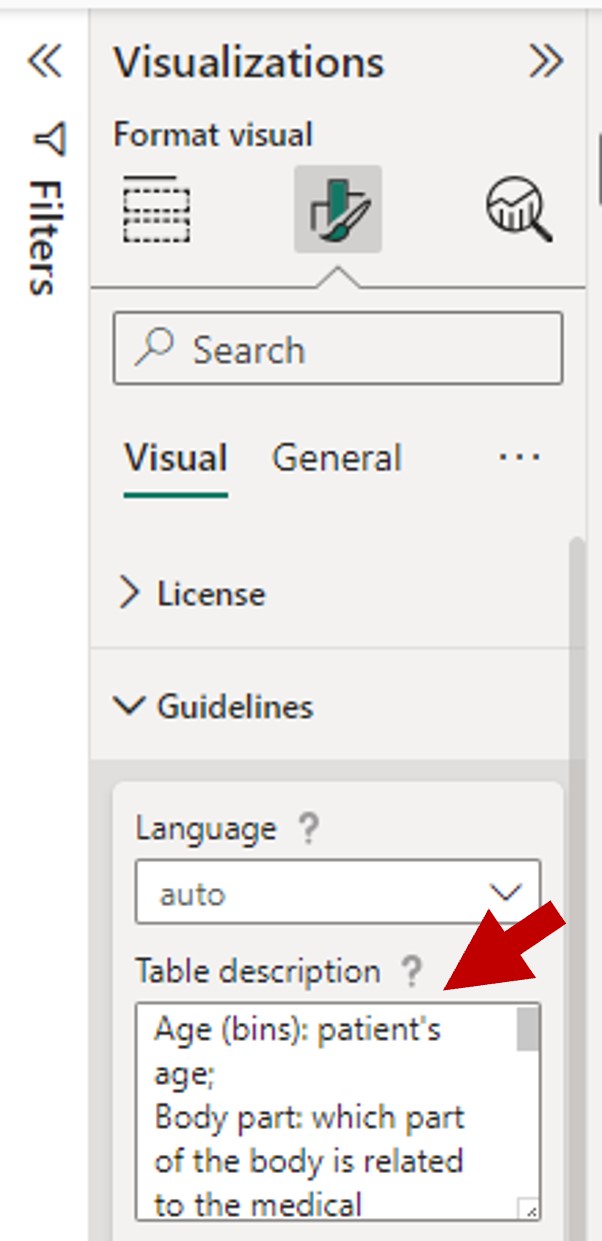
Age (bins): patient's age; Body part: which part of the body is related to the medical occurrence. For example, a patient with a sore throat symptom will have the Body part equal to 'neck soft tissue'; Gender: patient's gender; Patient ID: unique patient ID; Patient Name: patient's name; Symptom: symptom the patient was experiencing upon entering the hospital occurrence.
If any column has a more complex explanation, provide one or more examples. In the example above, the "Body part" column is categorical and has a relationship with the "Symptom" column. To make this clearer to the AI model, an example was provided that a patient with a sore throat symptom will have the value 'neck soft tissue' in this column.

You are an assistant embedded in a dashboard about medical occurrences in a hospital. For all questions, if you have an explanation for the results found, include it in your response. For example, if the user asks "What body part has the most occurrences for a male patient?" and upon analyzing the data, you find "Lumbar", provide an explanation for this: "The body part with the most occurrences is the Lumbar, possibly because men tend to perform more intense physical work, which, due to poor posture, repetitive effort over a long time, and high intensity, can lead to injuries in the lumbar area".
One point to note is that when dragging a date field into the visualization, Power BI by default converts it into a date hierarchy. To undo this behavior, click on the arrow next to the column name dragged into the visualization and choose the option with the column name instead of "Date Hierarchy".
The gif below illustrates this process.
How many times have you dragged some columns and measures to a table visual or other chart, and it presented a very weird result? The same can happen with the chatPowerBI visual, and if it has access to incorrect data, its responses will also be incorrect.
To do this, select the visual, click on the three-dot icon, choose "Show as table." Double-check if the values in the table are correct.
For example, consider a report that has the "Study rooms" dimension table, which lists study rooms available for booking, and a fact table named "ScheduleTable" indicating the times the rooms were reserved and who booked them.
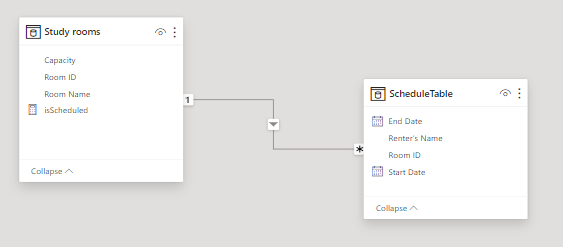
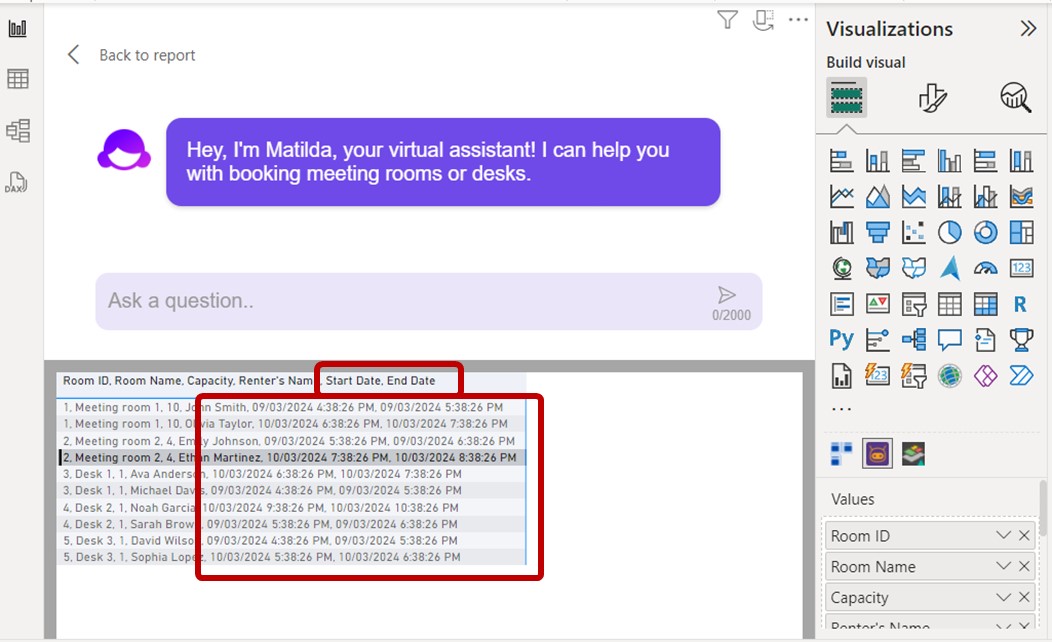
Note that if we drag columns from both tables into the Power BI visual, only rows with bookings will be displayed (see the previous tip to display the underlying data in the visual). However, rows without bookings are also important for the AI model to know which rooms are vacant. Without this information, the AI model will not be aware of their existence.
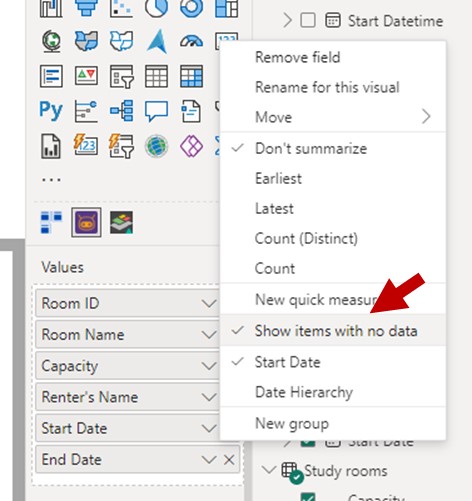
To display these rows, you need to enable the "Show items with no data" option. To do this, in the Values fields well, right-click the field and select "Show items with no data" from the menu that appears, as shown in the following image:
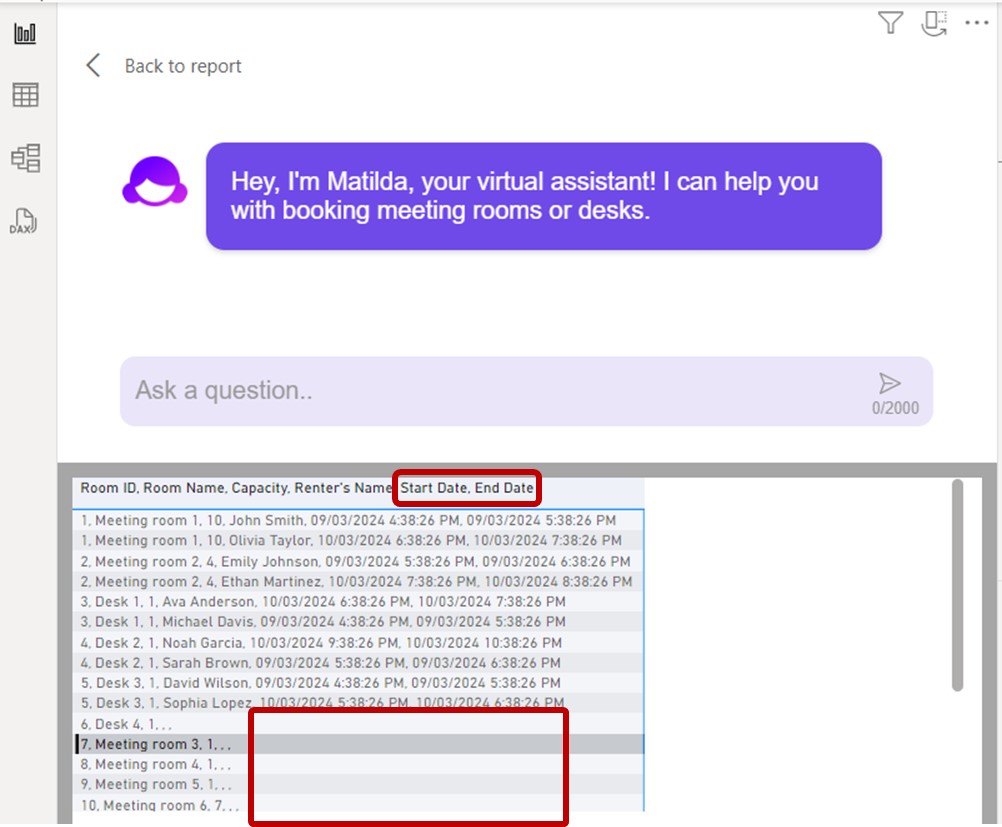
After activating this configuration, the rows without scheduling dates become visible to the AI model as well.
Due to the nature of the chatPowerBI visual, we recommend always disabling the impact of other visuals on it.
To do this, select one of the existing visuals, go to the "Format" tab, and choose "Edit interactions". Notice that all the other visualizations on the page now display interaction icons. The bolded icon is the one that is being applied. To prevent them from impacting the chatPowerBI visual, always choose the "no impact" icon
 .
. 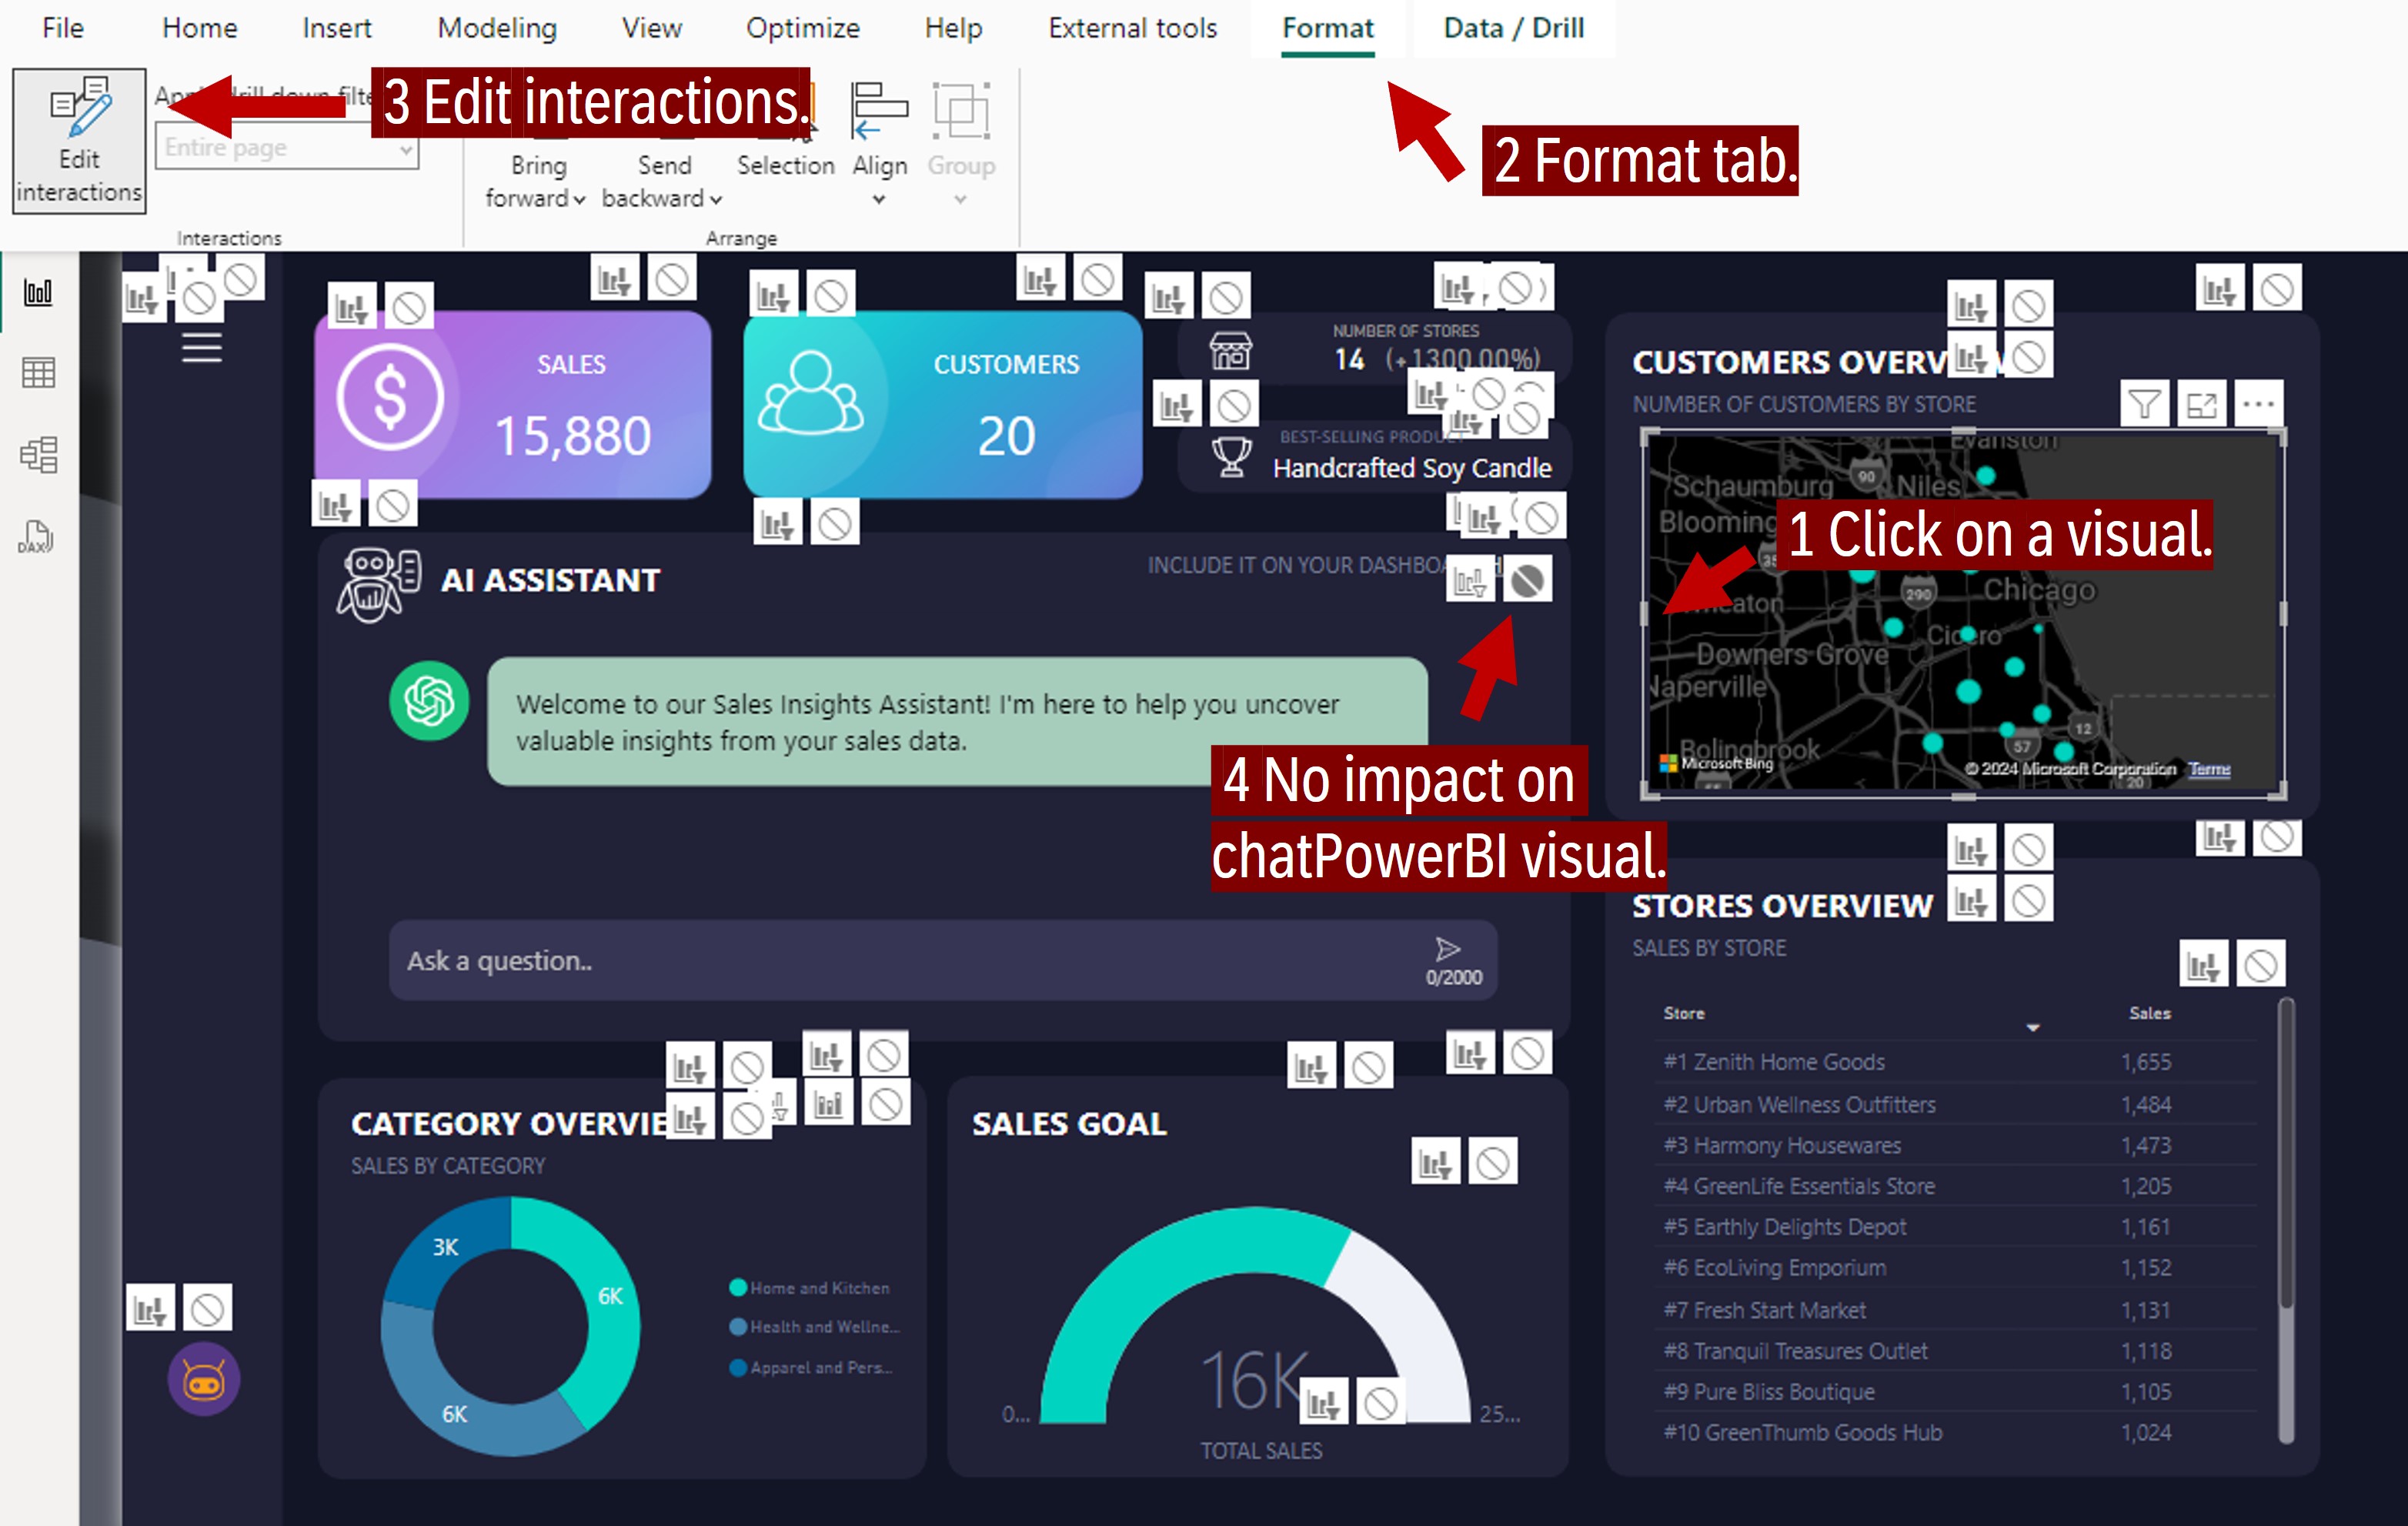
This process needs to be carried out for all other existing visuals.
- Use columns from Imported tables instead of Direct Query
Whenever possible, prefer using columns from imported tables rather than relying on Direct Query. These connection can significantly increase processing time, especially in custom visuals like chatPowerBI. This happens due to the need to fetch and process data in real-time, which can be time-consuming. - Avoid using measures
Just like with table connection types, use of measures can increase loading time. Instead of providing measures like "Total Sales for Current Year" and "Total Sales for Previous Year," provide simple columns like "Sales Value" and "Date." chatPowerBI itself can perform the necessary calculations to get the total sales for each year. This simplifies the process and speeds up data loading.