The installation of the chatPowerBI visual is quick and straightforward. In this article, we will guide you through all the necessary steps to use the visual.
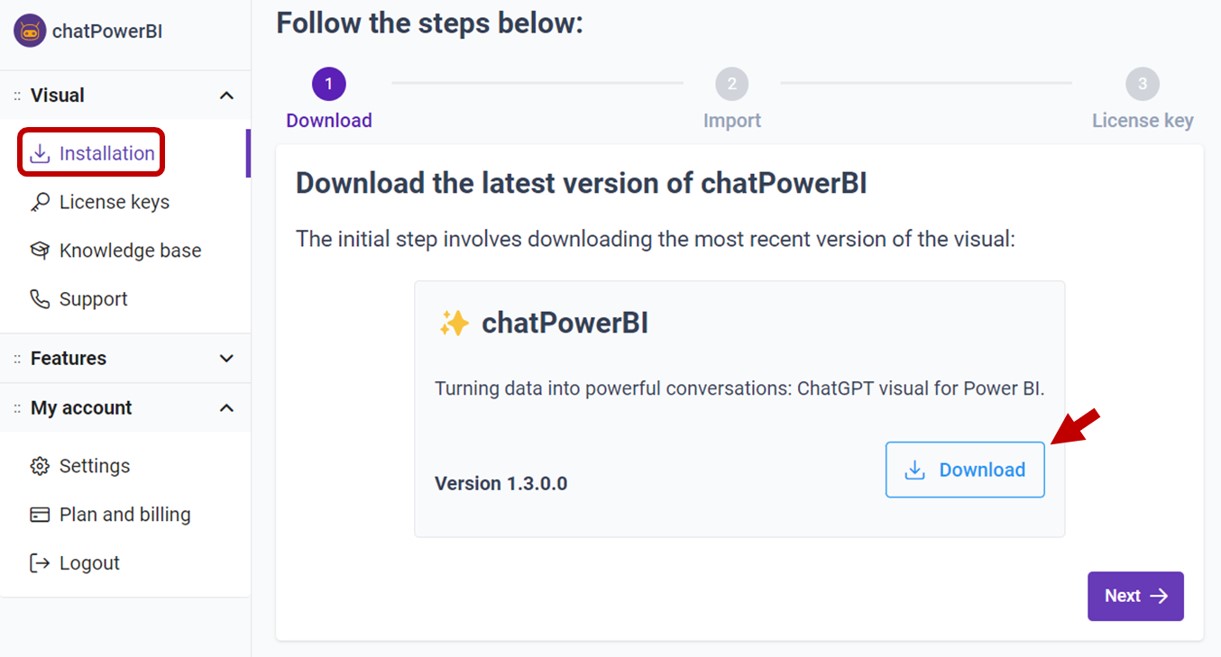
1. Open your report in Power BI Desktop or Power BI Service.
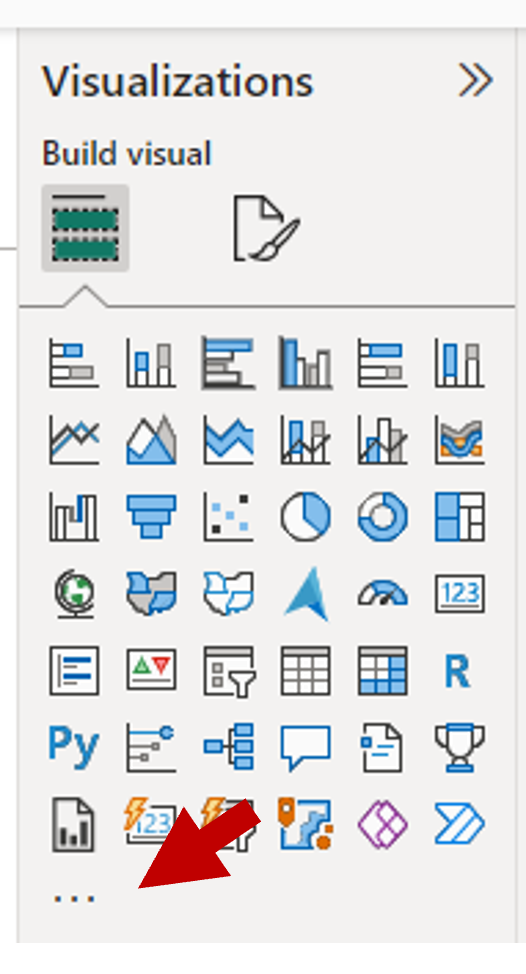
2. Select the ellipsis from the Visualizations pane.
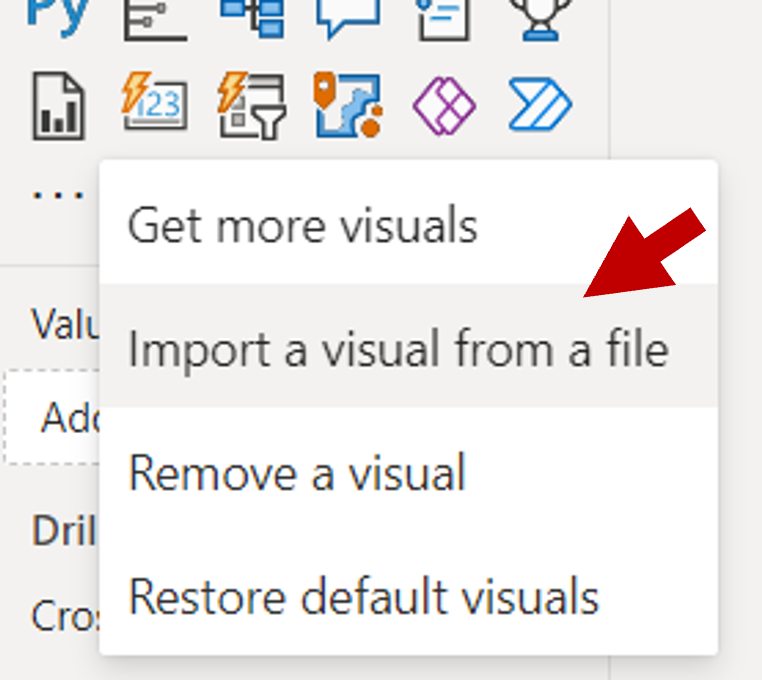
3. Select Import a visual from a file from the menu.
4. If you get a message cautioning you about importing custom files, select Import.

5. Navigate to the folder where you saved the downloaded visual.
6. When the visual has successfully imported, select OK.

7. The chatPowerBI visual now appears as a new icon in the visualizations pane of the current report. Select the visual icon to create the visual on the report canvas.
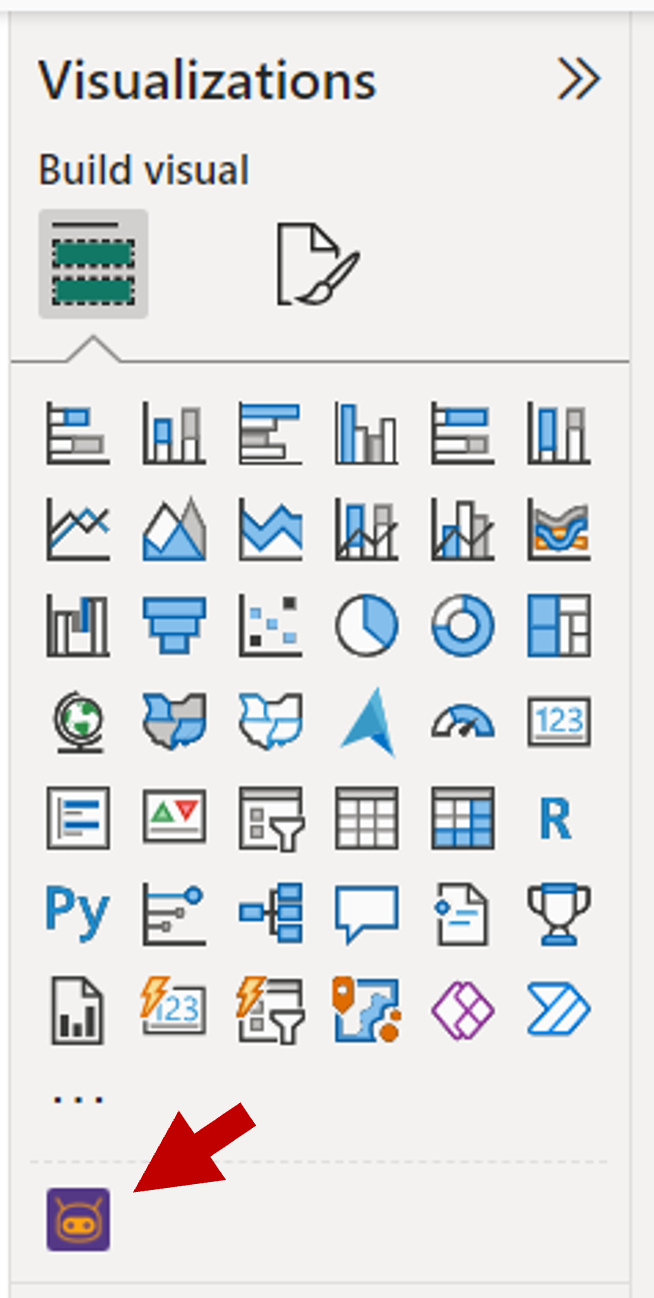
If you want the chatPowerBI visual to remain on the Visualizations pane so you can use it in future reports, right-click the visual's icon and select Pin to visualizations pane.
To enable chatPowerBI functionality, you must provide a license key regardless of your plan modality (free or premium). You can generate this key on your User Panel within the License Keys section. Further instructions on how to generate them are detailed in this article.
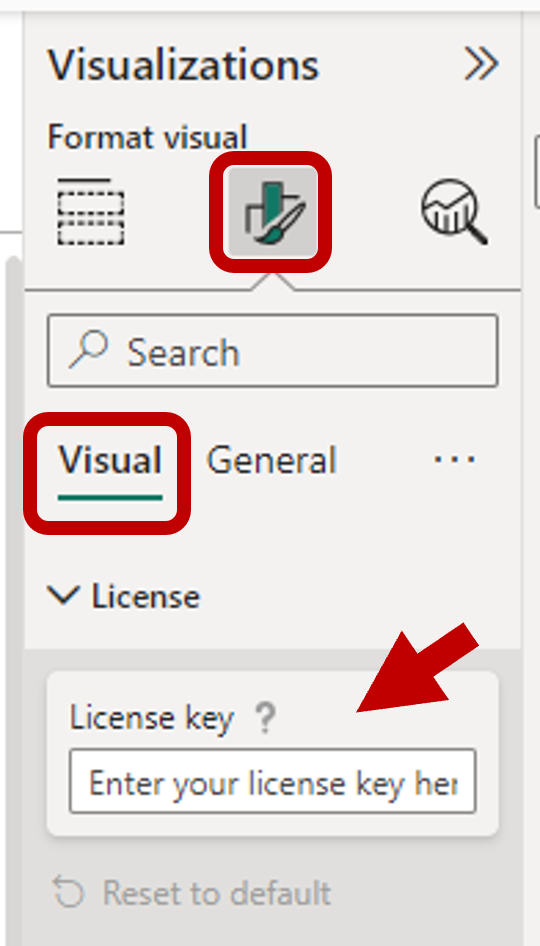
After adding the visual to your report, in the Visualizations pane, go to the Format your visual > Visual tab and in the License section paste your license.
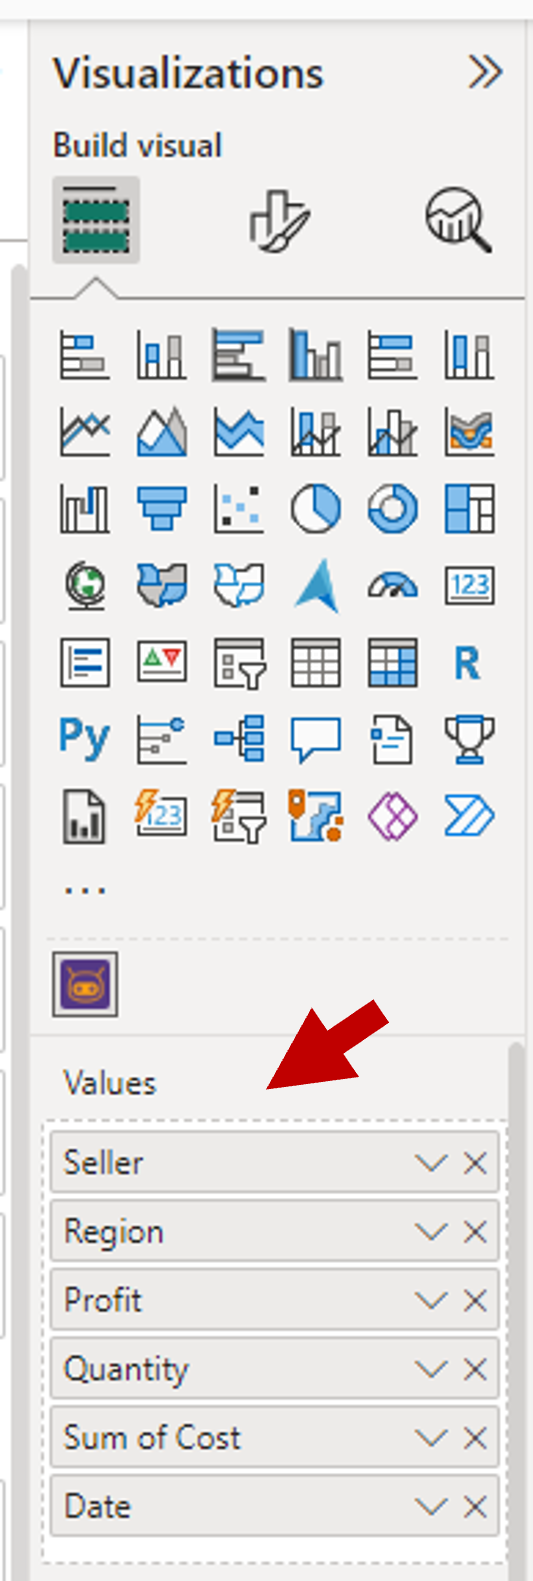
In the Visualizations pane drag the columns and measures that the assistant should be aware of.
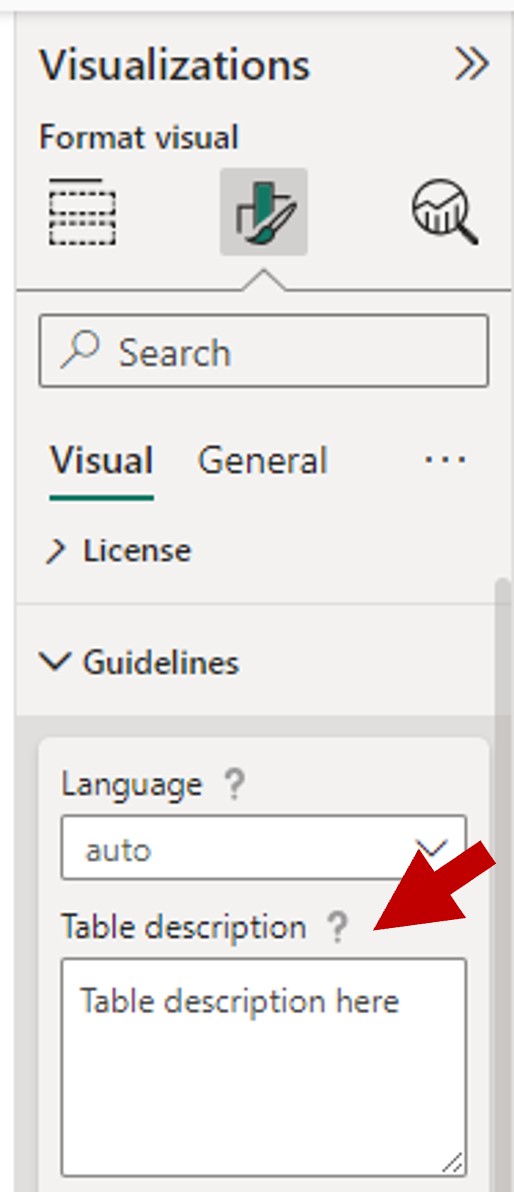
On the same panel, for better accuracy, it's important to fill out a table description in the 'Guidelines' section.
We strongly recommend reading the best practices article so that you can fully harness the potential of artificial intelligence.
Now, just start chatting with the assistant to gain insight into your data!
To download ready-made report templates, visit our use cases section.